
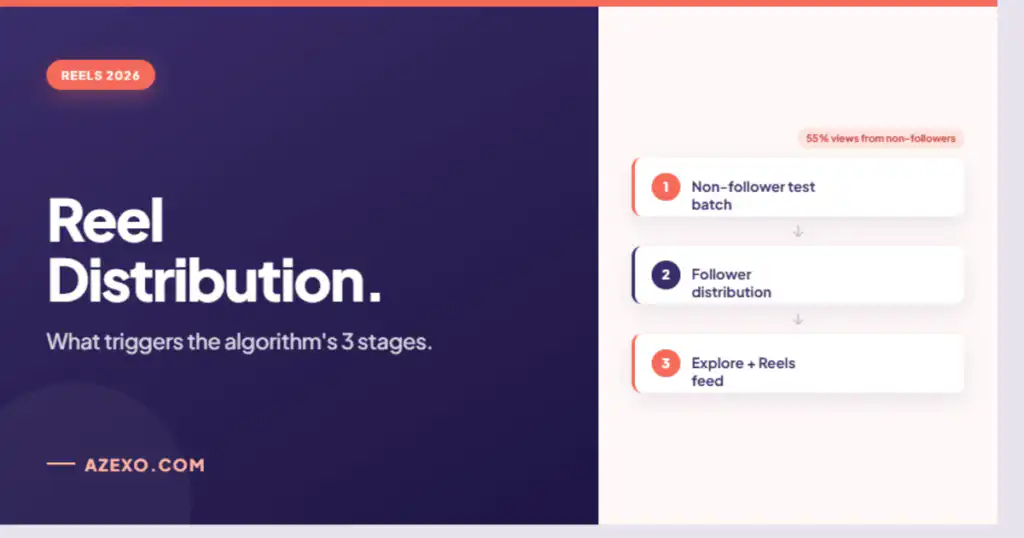
- Instagram Reels are tested against non-followers first, then distributed to followers, then pushed to Explore — each stage gates the next
- The three confirmed ranking signals are watch time, sends per reach (DM shares), and likes per reach — in that priority order
- DM shares are weighted 3 to 5 times higher than likes for reaching non-followers
- Skip rate above 50 percent causes Instagram to reduce distribution — the first 1.5 seconds are the critical hook window
- 55 percent of Reel views come from non-followers, making Reels the primary discovery surface on Instagram
How the Three-Stage Distribution Model Works
Every Reel Instagram receives goes through a sequential evaluation process. The stages are not parallel — each one only runs if the previous one passes a minimum performance threshold.
Instagram shows the Reel to a small audience of non-followers whose interests match the content’s topic signals. Performance is measured against the three ranking signals: watch time, sends, likes. If the Reel clears the initial test, it begins appearing in followers’ Feeds and the Reels tab. Strong early engagement from followers further boosts distribution. High-performing Reels get pushed to Explore and the broader Reels feed, reaching progressively larger audiences. Each wave of engagement triggers the next.
The specific implication: a Reel that fails the first test against non-followers never reaches your own followers in the Reels tab in a meaningful way. It may appear in some follower feeds through standard Feed ranking, but the Reels distribution machine — the one that reaches non-followers and drives account growth — does not engage. 55 percent of Reel views come from people who do not follow the creator. Those views come entirely from stages two and three. If stage one fails, that 55 percent never appears.
The Three Confirmed Ranking Signals
Adam Mosseri confirmed in January 2025 the three signals that govern Reels distribution. They have not changed in 2026, but how Instagram weights and applies them has evolved.
The most impactful signals are shares, watch-through rate, saves, and replay rate, roughly in that order. Shares have become the single most important signal. When a viewer sends your Reel to someone via DM, Instagram interprets that as a strong endorsement. A Reel with a high share rate will almost always outperform a Reel with high likes but low shares.
The hierarchy in 2026 is concrete: DM sends are weighted 3 to 5 times higher than likes for reaching new audiences. Watch time is the single most important signal across all surfaces. Saves are weighted roughly 3 times higher than likes. Likes per reach is still measured, but carries less weight than watch time or sends.
What this means for how to evaluate Reel performance: a Reel with 40 DM shares and 200 likes is performing better algorithmically than a Reel with 500 likes and 5 shares. The share number is the one that triggers expanded distribution.
Skip Rate: The Distribution Killer Most Creators Miss
Skip rate is now the top-weighted factor in Instagram’s own “What impacts your views” dashboard, which Instagram released in early 2026. A skip rate of 30 to 40 percent is considered healthy. Above 50 percent and Instagram interprets your Reel as low-quality content and reduces its distribution.
The operational implication: the first 1.5 seconds of a Reel determine skip rate. Up to 50 percent of viewers drop off in the first three seconds. Reels with strong 3-second hold rates above 60 percent outperform those with weak holds below 40 percent by 5 to 10 times in total reach.
Skip rate is primarily a hook problem. Opening a Reel with dead air, a slow pan, or generic setup wastes the window. Text overlay that creates immediate curiosity, a direct-to-camera statement that promises something specific, or a visual that is arresting enough to stop the scroll — those are the patterns that produce hold rates above the healthy threshold.
What automatic likes contribute here is indirect. The first three seconds determine distribution; hooks matter more than editing polish. But a Reel that has visible engagement from the moment it appears in someone’s feed is more likely to get that initial pause. A viewer who sees 180 likes on a Reel is more likely to let it play than one who sees 4. That first pause is what determines whether the skip rate calculation starts from a stop or from a scroll-through.
The “Your Algorithm” Feature and What It Means for Topic Signals
In December 2025, Instagram launched “Your Algorithm for Reels,” which lets users explicitly select the topics they want to see in their Reels recommendations. For creators, this means content needs to clearly match the topics your target audience has selected. If your content’s topic signals do not match what your target viewers have told Instagram they want, the initial test batch will be drawn from an audience that is not interested in your niche.
The practical implication: Reels need clear topic signals in the caption, audio choice, visual content, and hashtags. Instagram’s AI categorizes content based on all of these inputs. Vague or mixed-topic content gets matched to a wider but less relevant test audience, which produces lower watch-through rates, which produces worse skip rates, which stalls stage one distribution.
Niche clarity is now an algorithmic requirement. A fitness creator who posts occasional food content without topic differentiation risks having food posts tested against a fitness audience that was not interested. Consistency in topical focus keeps the initial test batch accurate.
Trial Reels: How the Stage One Test Works in Practice
When you post a Trial Reel, Instagram shows it to non-followers first and measures how they respond. If engagement is strong, the Reel gets pushed to your followers. If not, you can delete it without your existing audience ever seeing underperforming content.
Trial Reels make the normally invisible stage one test visible. The performance data from the trial period — particularly completion rate and share rate from non-followers — tells you directly whether a piece of content has genuine reach potential before committing it to your main feed. For accounts testing new formats or audience angles, this feature removes the risk of stalling your main feed’s distribution history with underperforming experiments.
The data Trial Reels produce maps directly onto what the algorithm measures. High completion rate and share rate from the trial non-follower sample are strong predictors of stage two and stage three distribution. Low numbers on either are a signal to rework the hook or topic before publishing broadly.
Where Azexo’s Automatic Likes Fit Into the Reels Distribution Model
Reels and feed posts share the same first-window evaluation logic. Azexo’s automatic likes subscription detects new posts, including Reels, within approximately 60 seconds of publication and begins gradual delivery. This creates the initial social proof signal that increases the probability of organic viewers pausing on the Reel instead of scrolling past it.
The connection to distribution: likes per reach is the third confirmed ranking signal. A Reel that gathers likes quickly relative to the number of accounts that have seen it signals to Instagram that the content is resonating with its test audience. Automatic likes contribute to that ratio in the initial distribution window.
They do not substitute for watch time or DM shares, which are the signals that carry more weight. But they contribute to the social proof that makes organic viewers more likely to stop and watch, which is the behavior that generates the watch time and shares the algorithm actually weights most heavily. For accounts also using Azexo’s Instagram views service to boost Reel view counts, the combination of visible views and likes creates a stronger first-impression signal than either alone.
Instagram matches content to non-followers based on topic signals extracted from the Reel’s visual content, audio, caption, and hashtags. It then tests the Reel against a small pool of non-followers whose interests align with those topic signals. Performance on watch time, DM shares, and likes in that test determines whether distribution expands.
Watch time is the single most important signal across all Instagram surfaces. For non-follower reach specifically, DM shares are weighted 3 to 5 times higher than likes. A Reel with high shares and moderate likes will outperform one with high likes and low shares.
Skip rate is the percentage of viewers who scroll past a Reel without stopping to watch it. Instagram confirmed in 2026 that skip rate is the top factor in its “What impacts your views” distribution assessment. A skip rate above 50 percent causes Instagram to reduce distribution. The first 1.5 seconds are the primary determinant of skip rate.
For most creators, 7 to 30 seconds produces the highest completion rates and strongest distribution. Reels up to 3 minutes can now appear on Explore, making longer educational or storytelling content viable if retention is high throughout. The key is completion rate, not length: a 30-second Reel with high completion will outperform a 3-minute Reel that loses viewers halfway through.
Launched in December 2025, “Your Algorithm for Reels” lets users explicitly select the topics they want to see in Reels recommendations. For creators, this means content needs clear topic signals that match what your target audience has told Instagram they want. Content with mixed or unclear topic signals gets tested against less relevant audiences, producing worse distribution outcomes.
Nano accounts under 10,000 followers typically see 500 to 5,000 views per Reel. Micro accounts between 10,000 and 100,000 followers typically see 5,000 to 50,000. A useful benchmark: if your Reels consistently reach 2 to 5 times your follower count in views, your content strategy is working with the distribution algorithm.
Early Engagement on Every Reel, Before the Algorithm’s First Window Closes
Real accounts. Gradual delivery. 60-second post detection. Built on igautolike.com infrastructure since 2014.
View Plans No contract · Cancel anytime · Works on Reels and feed posts